For over 50 years, TV research has relied on ratings. By knowing how many people watched a show, programmers could build their schedules to create blocks of must-see TV and set advertising prices to reach those audiences. The math behind viewership was straightforward and simple. Linear television had linear programming measurement.
But it’s no longer enough to know how many people watched a show. You need to know which shows draw new viewers, which shows keep them with you, and what else they're watching that might lure them away. You need to understand the lift that programming creates, and its influence on subscriber actions. This new framework informs the programming decisions that move the needle for streamers and quantifies the impact of creators’ work. And you need to see all this, not just on your own platform, but across every streaming service on the market.
That’s why we’re thrilled to unveil Subscriber Views. Building on Antenna’s market-standard subscriber counts, this new solution connects viewership behavior directly to subscription decisions. Using AI and advanced machine learning, Subscriber Views goes beyond traditional audience reach metrics to consider not only who watched, but what they did before and after tuning in. It is the same type of sophisticated content analytics that streamers already do on their first-party data, but for the entire market.
Subscriber Views allows streamers and show sellers alike to track which shows drive sign-ups (Acquisition), identify shows that generate loyalty and prevent churn (Retention), and analyze how different viewer cohorts behave on and off a given service (Engagement).
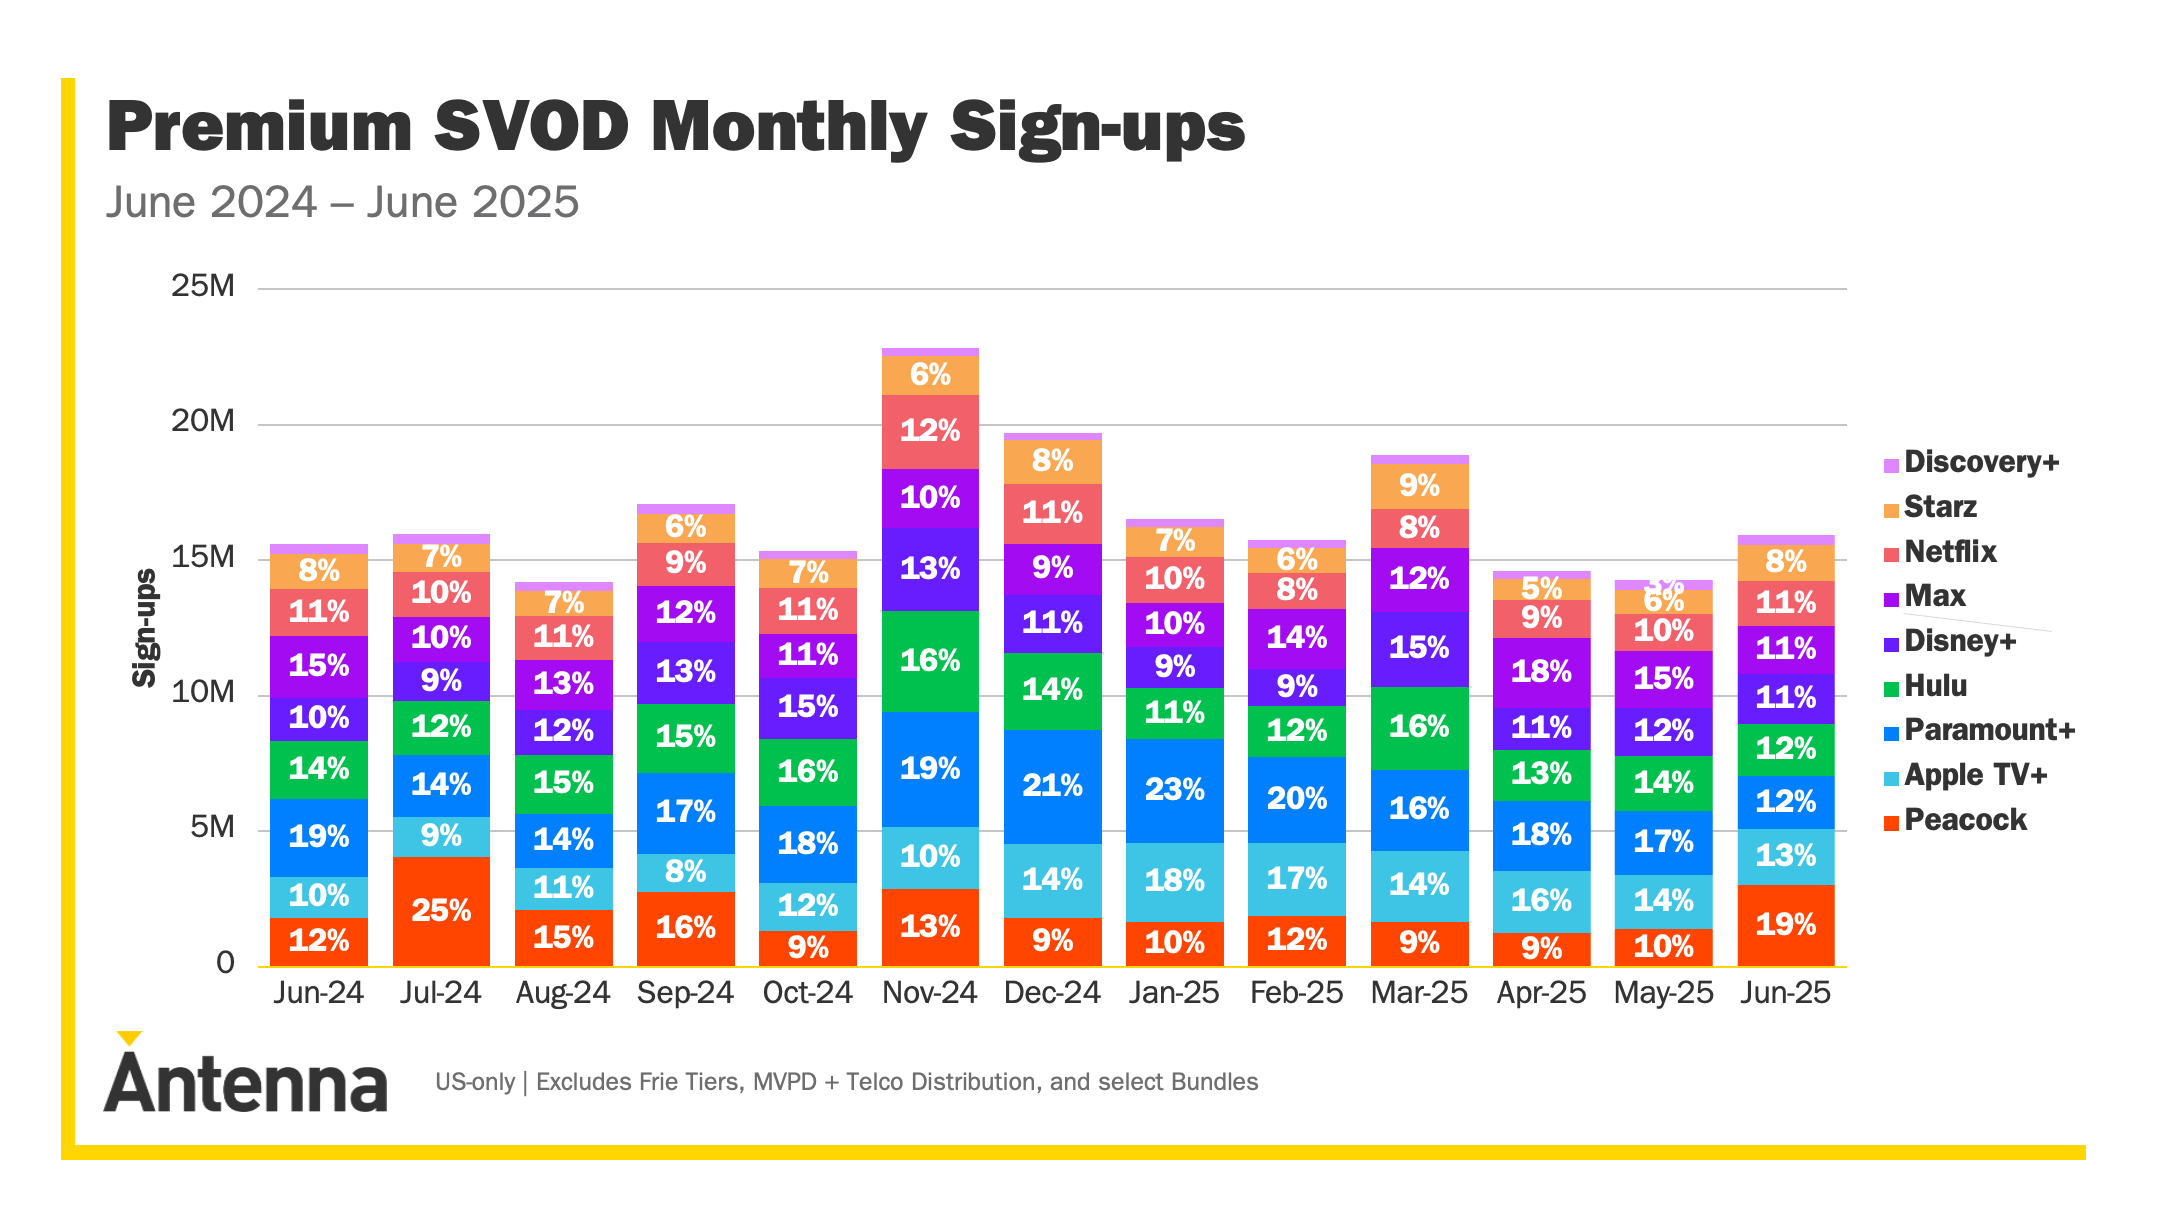
Let’s take Acquisition. Since our inception, Antenna has been known for our estimates of sign-ups to streaming services. For example, as noted in the chart below, some 13% of Sign-ups to Premium SVOD services in June 2025 went to Apple TV+.
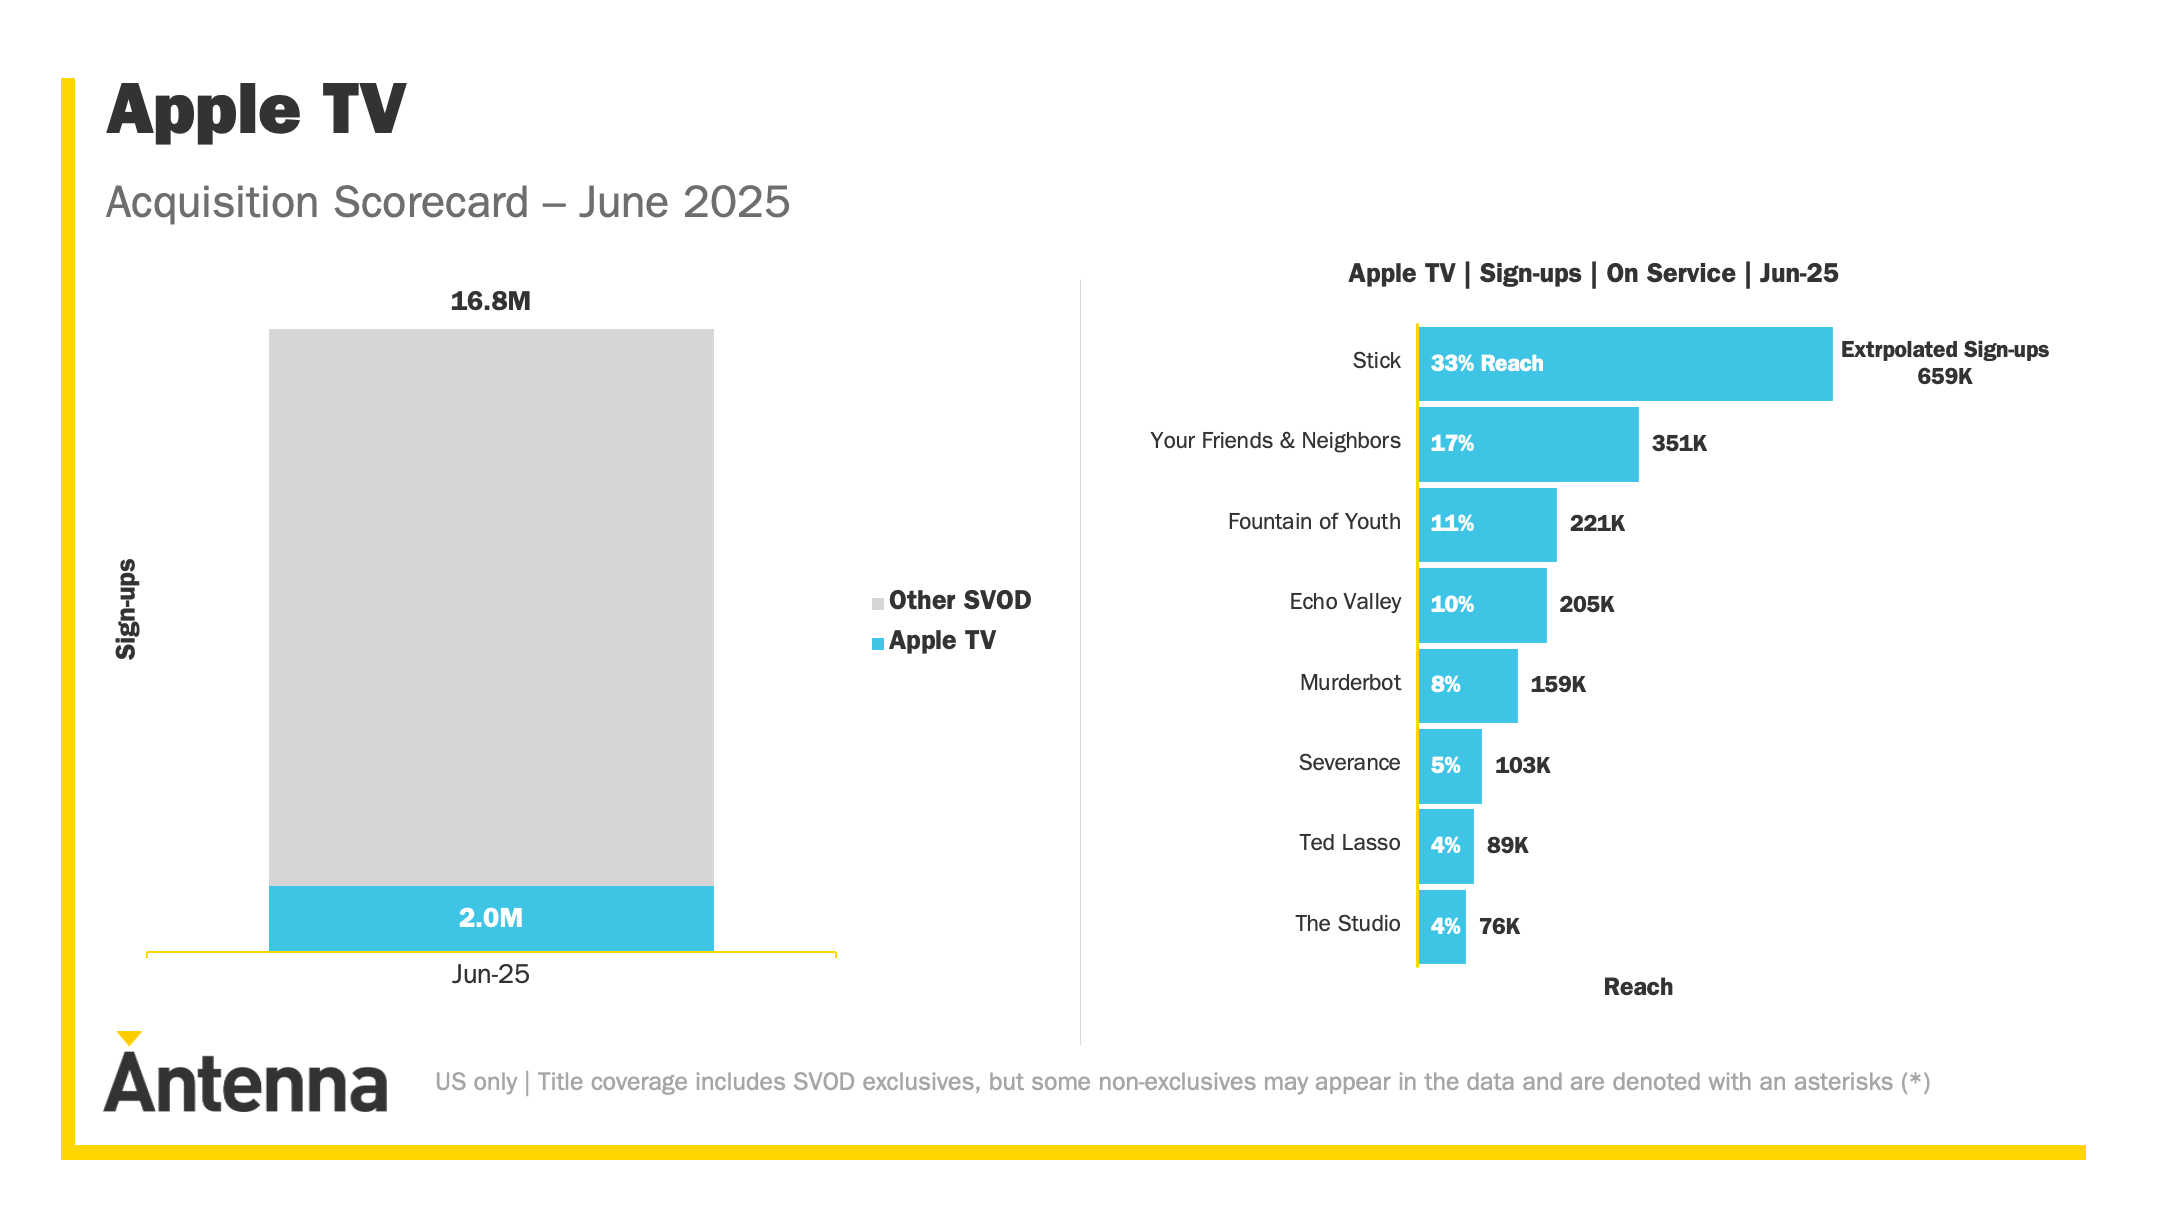
With Subscriber Views, we can now see which shows drove those sign-ups. In the figure below, Antenna estimates that the most popular show on Apple TV+ among new subscribers in June 2025 was Stick, with 33% of them, or just under 700k, watching.
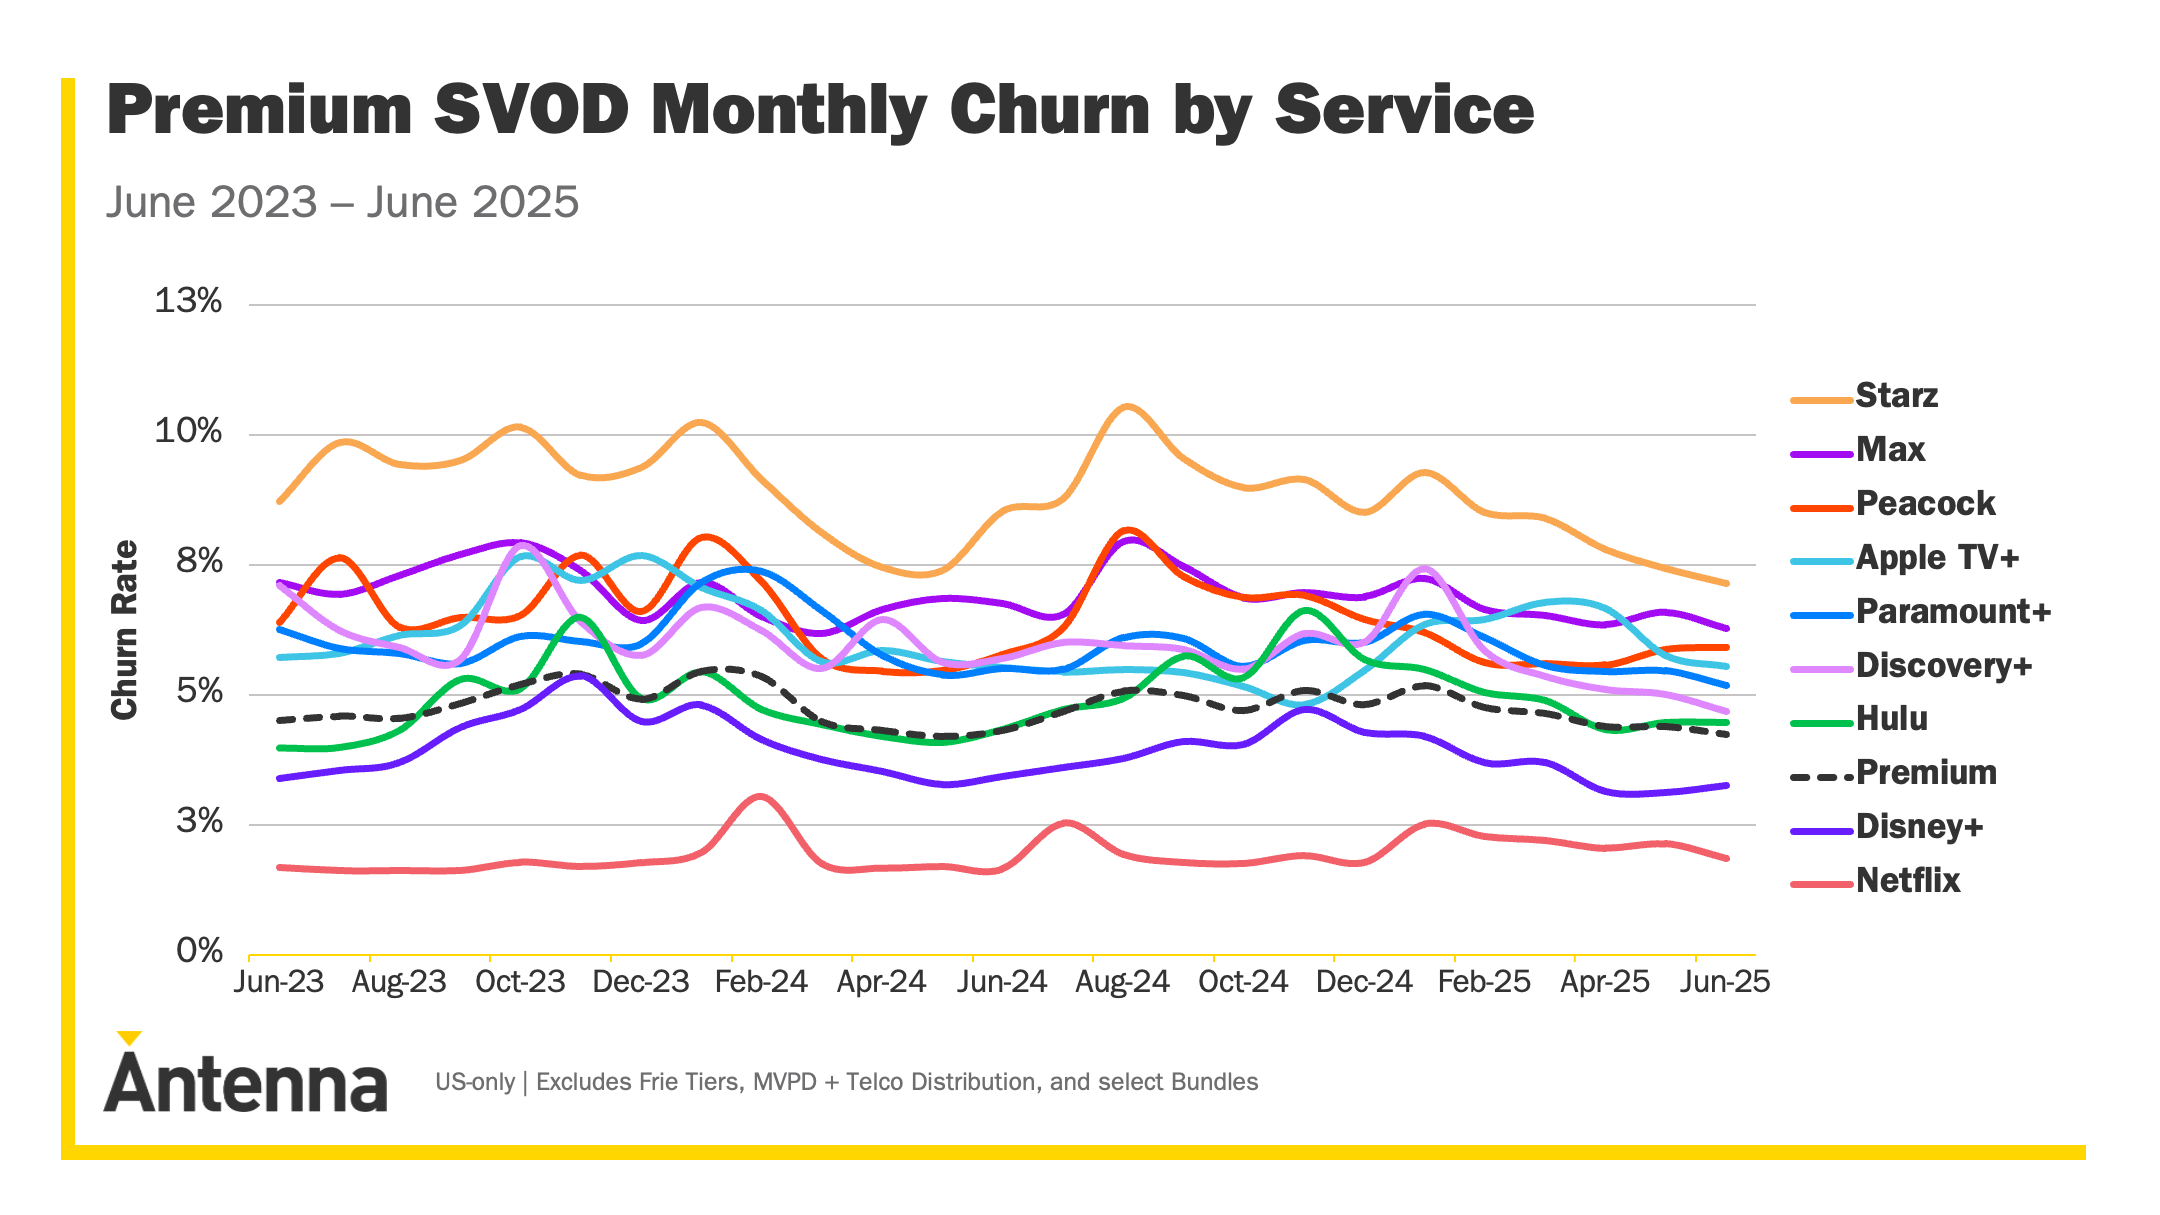
It’s similar for Retention. Antenna is well known for its churn metrics. Below is a familiar chart to many, showing the monthly churn rate for the Premium SVOD category from June 2023 through June 2025. Here, we see Antenna estimated Apple TV+ had churn of about 5.5% in June 2025.
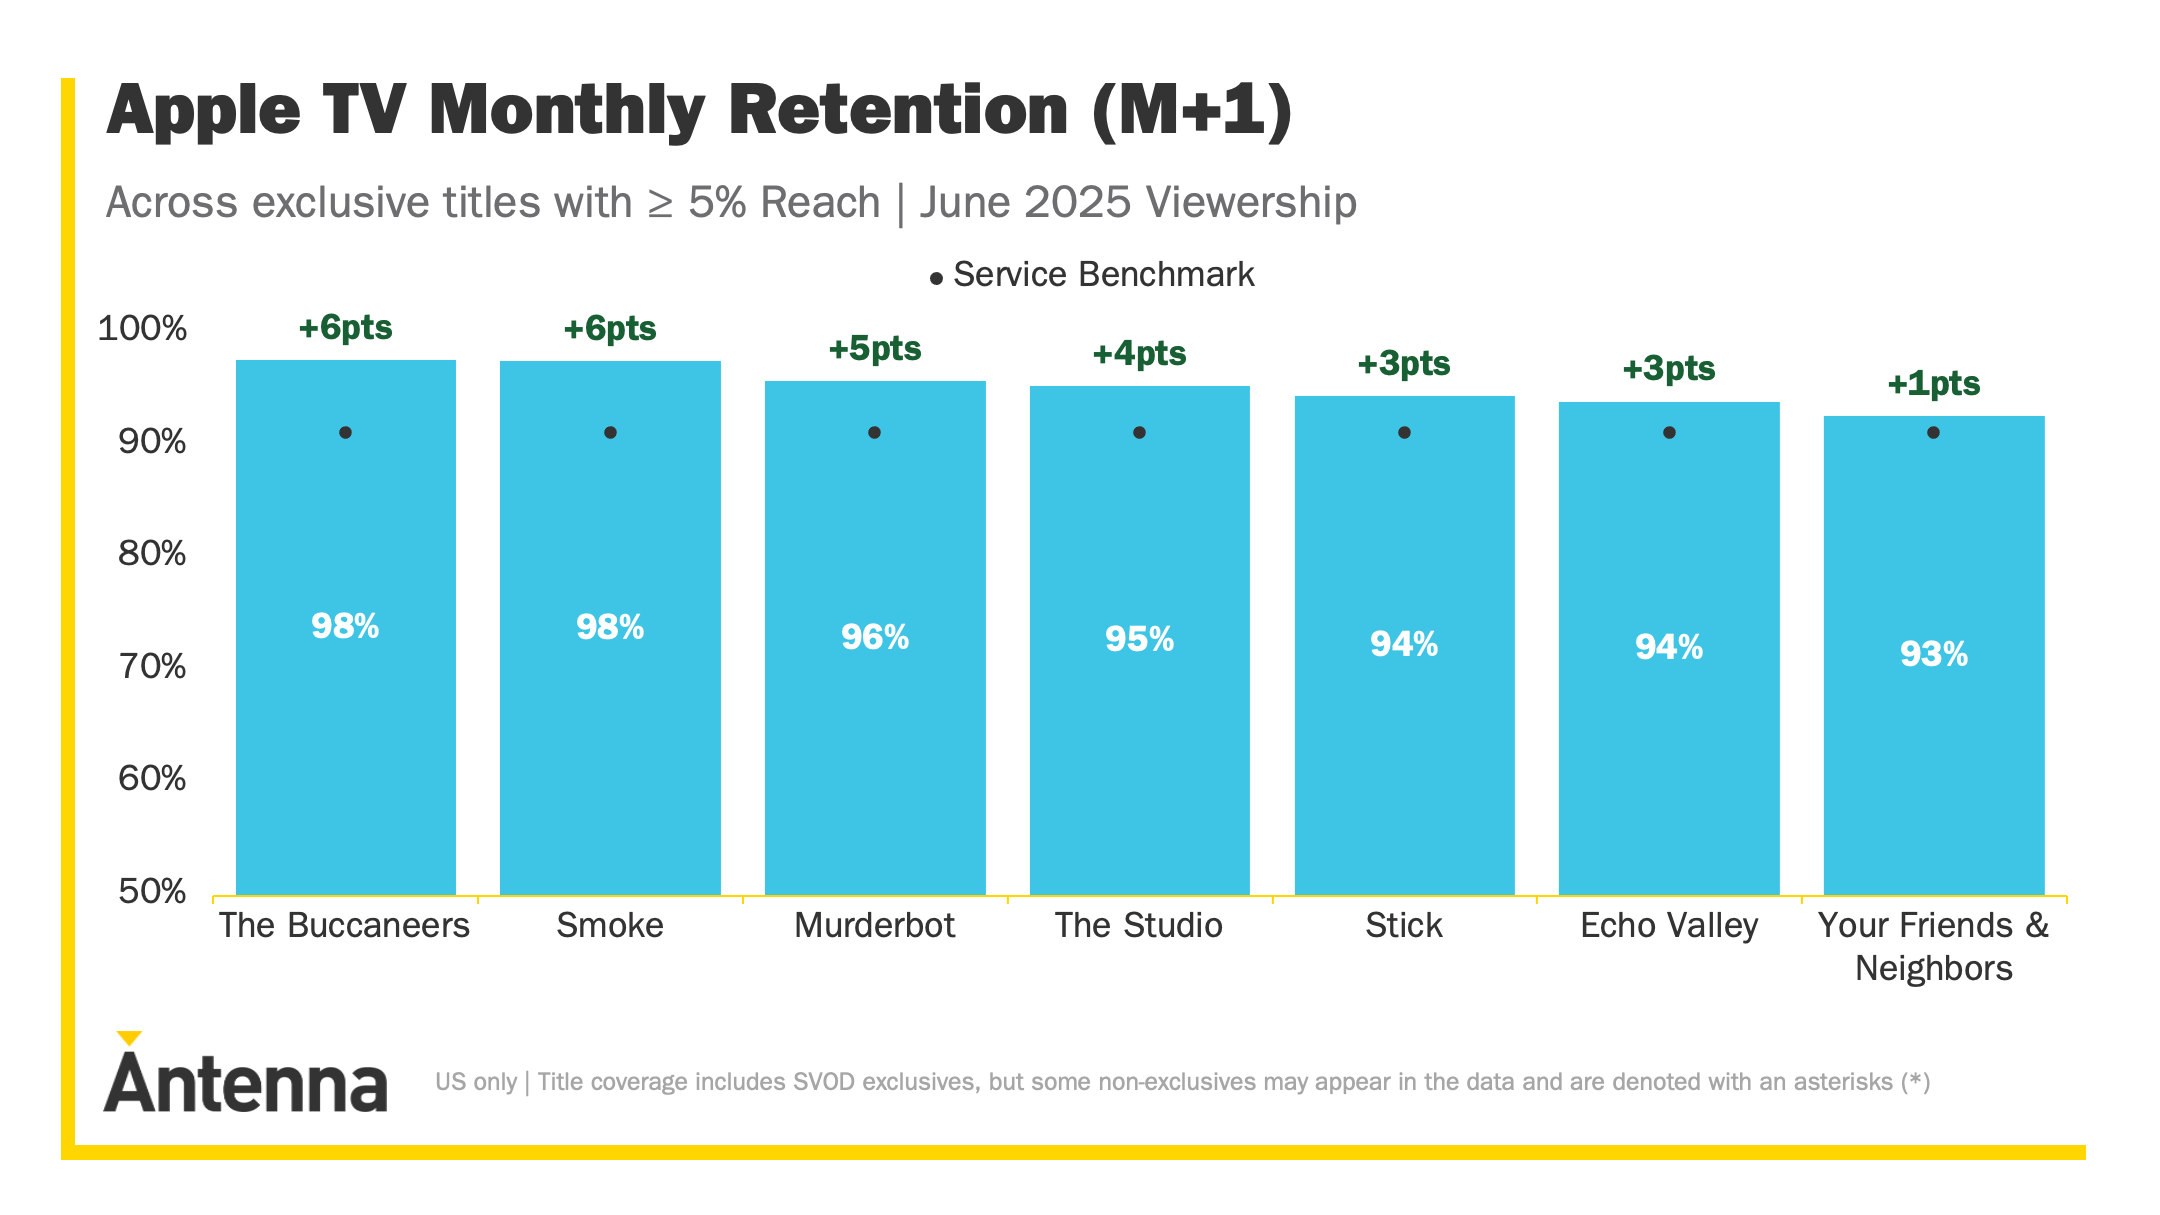
Now with Subscriber Views, we can see the retention rates for viewers of specific shows. For instance, in the figure below, Antenna estimates that 98% of Apple TV+ Subscribers who watched The Buccaneers in June 2025 were still subscribed at the end of July, compared with the 92% benchmark for all Apple TV+ Subscribers.
Antenna’s Subscriber Views provides an important, multi-dimensional perspective on show performance that we believe will revolutionize the streaming market. It is a critical missing piece of the media puzzle that should empower show buyers, show sellers, and service operators to make more informed decisions about their programming and their businesses.
In the coming days and weeks, we’ll share more examples of the kinds of insights that are revealed by integrating viewership data and subscriber metrics.
In the meantime, if you’re interested in learning more about Subscriber Views, drop us a line - we’d love to talk! And if you’re not already subscribed to receive our monthly newsletter, The Signal, what are you waiting for? Sign up today!